The Business of Age
The Business of Age

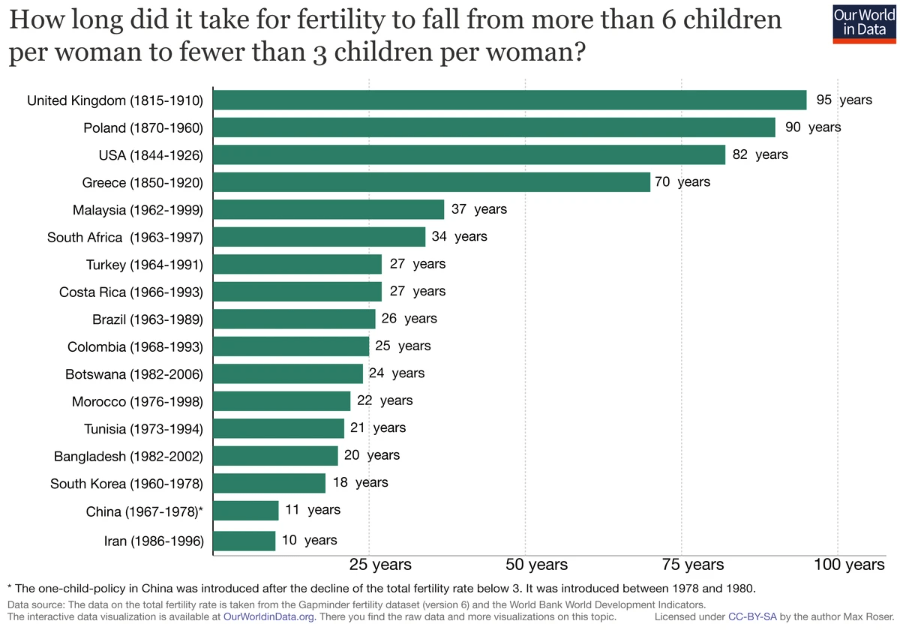
Since the 1950's Fertility has fallen dramatically around the world.
The number of children a female has in their lifetime must remain above 2.1 to retain the total population. This is the replacement rate.Updated December 2022

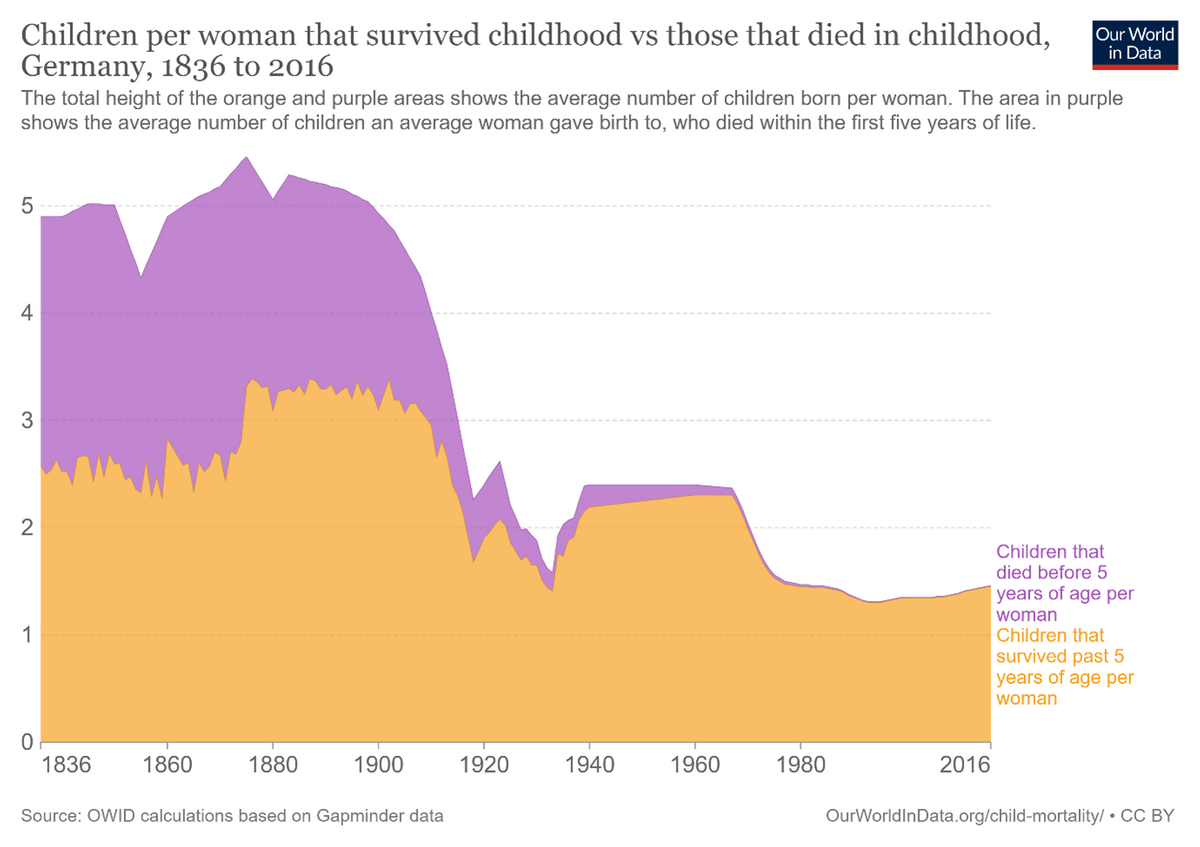
Between 1840 and 1870, the number of surviving children was virtually the same as between 1940 and 1970
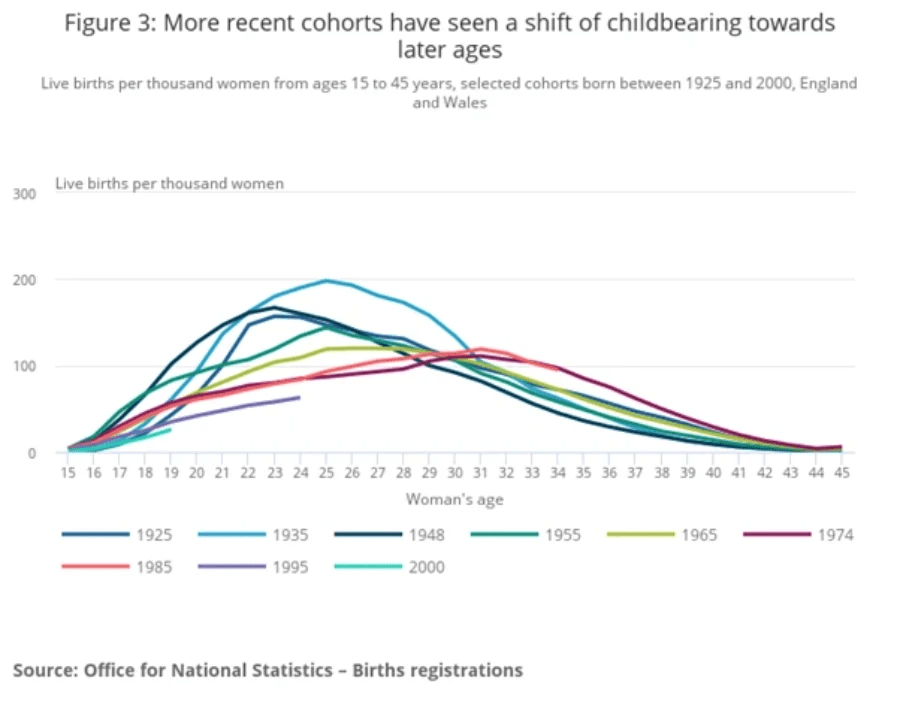
In the nineteenth century, an average of five children per female were born. Sadly half of them died, leaving a family around the replacement level of 2.5 (at that time). A century later the number of children dying had plummeted and the birth rate with it. Families however continued to replace themselves. They averaged 2.2 - 2.5 children per female.For the first time half the women aged 30 were childless
The UK Office of National Statistics Reported in 2022.

The Rate of decline in Fertility is Accelerating

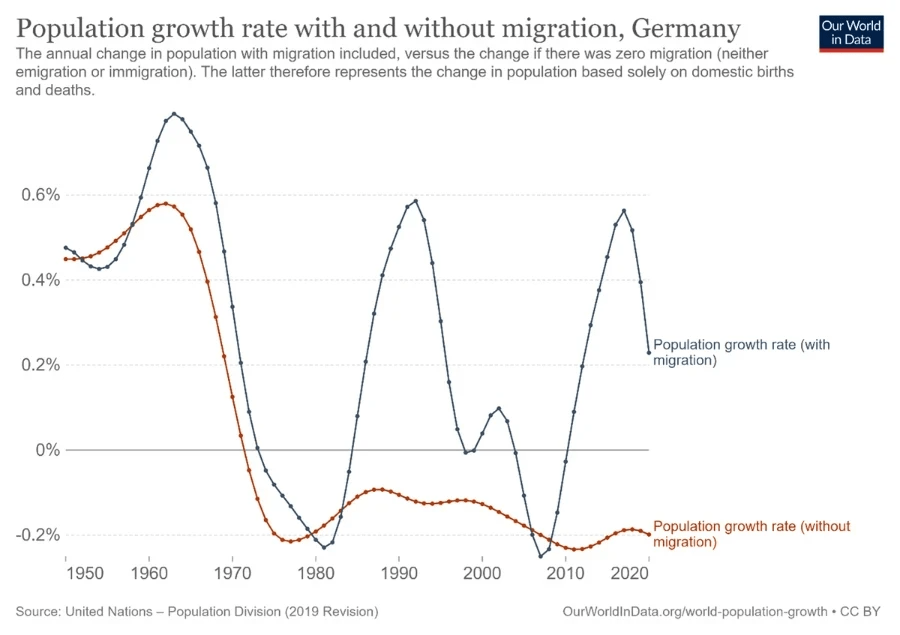
The German Market has depended on immigration since 1972
Population goes negative in the mid- seventies without immegration. This is when the fertility rate drops below the replacement level. Immigration returns the population to growth in the nineties and again in recent years.

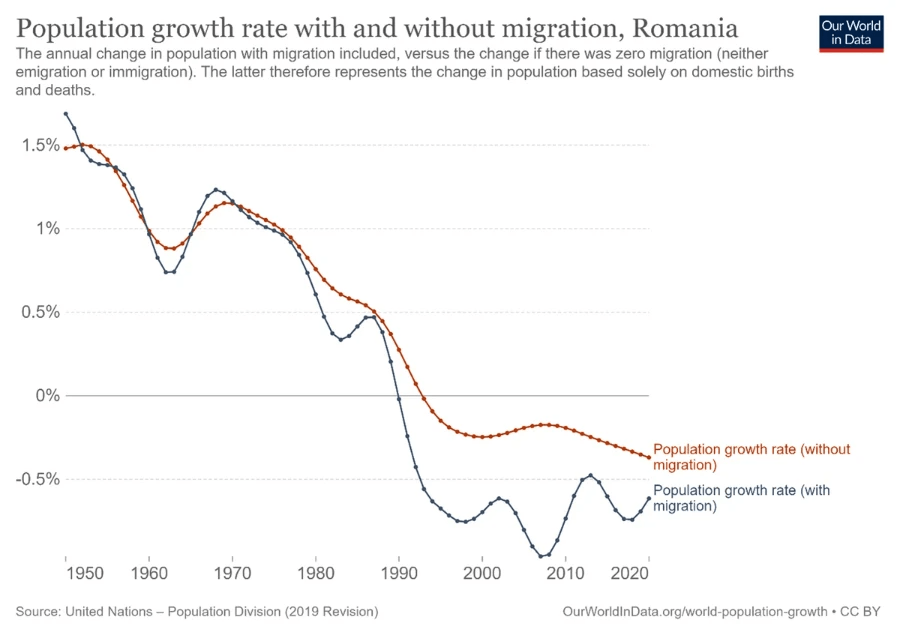
Romania did not drop below replacement level fertility until 1992
In this case the drop in fertility was compounded by migration. Romania dropped below replacement level around 1993. At the same time migration accelerated. The population has been in decline ever since.


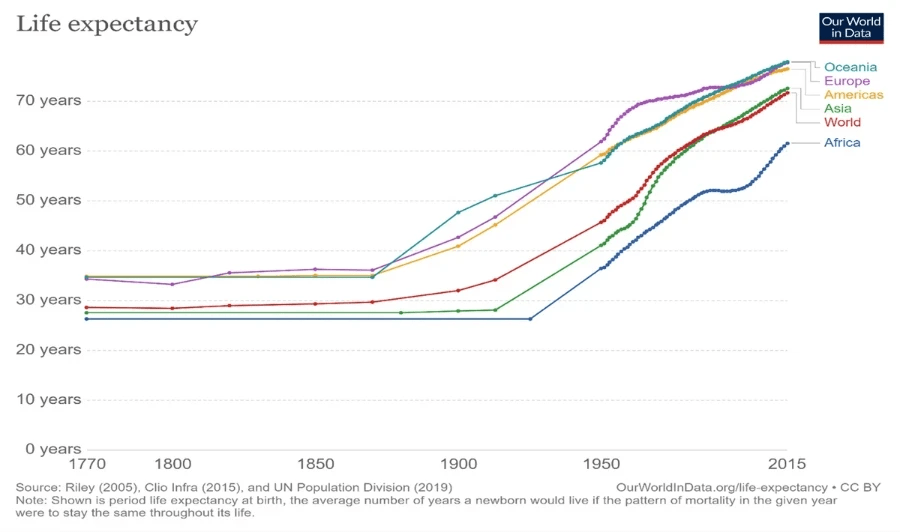
The Continents are Converging in Life Expectancy.
After an early lead by Europe, the Americas and Oceania the other continents are now accelerating and catching up.
After an early lead by Europe, the Americas and Oceania the other continents are now accelerating and catching up.
Updated 2019

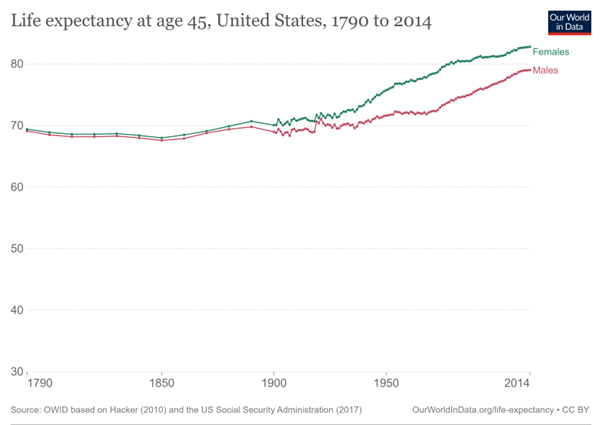
Much of the gain has come by reducing child mortality. From 1790 US life expectancy at 45 remained at 68-70 until the middle of the last century. Overall life expectancies were low because of the children who died.
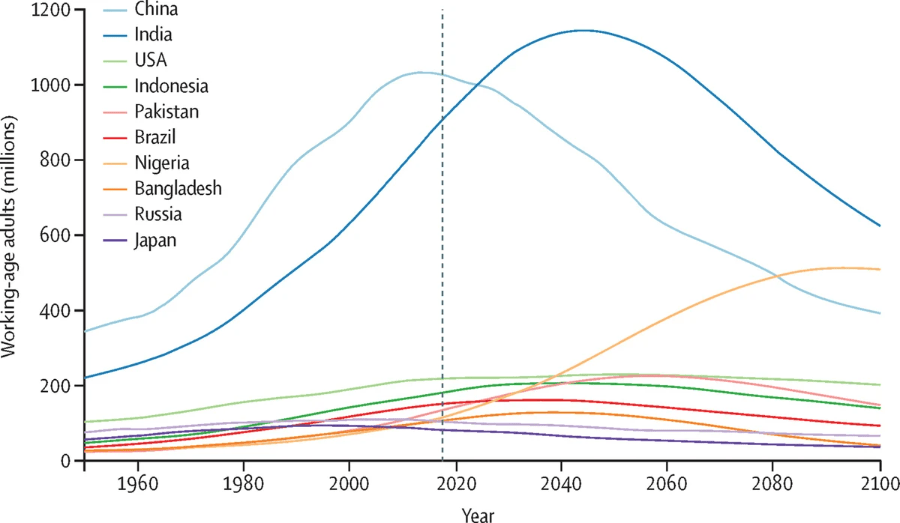
By the Turn of the Century the Working Population of China will decline by a half.
The latest forecast from the University of Washington forecasts a Chinese Working Population at the same level as 1955 by 2100

The latest forecast from the University of Washington forecasts a Chinese Working Population at the same level as 1955 by 2100

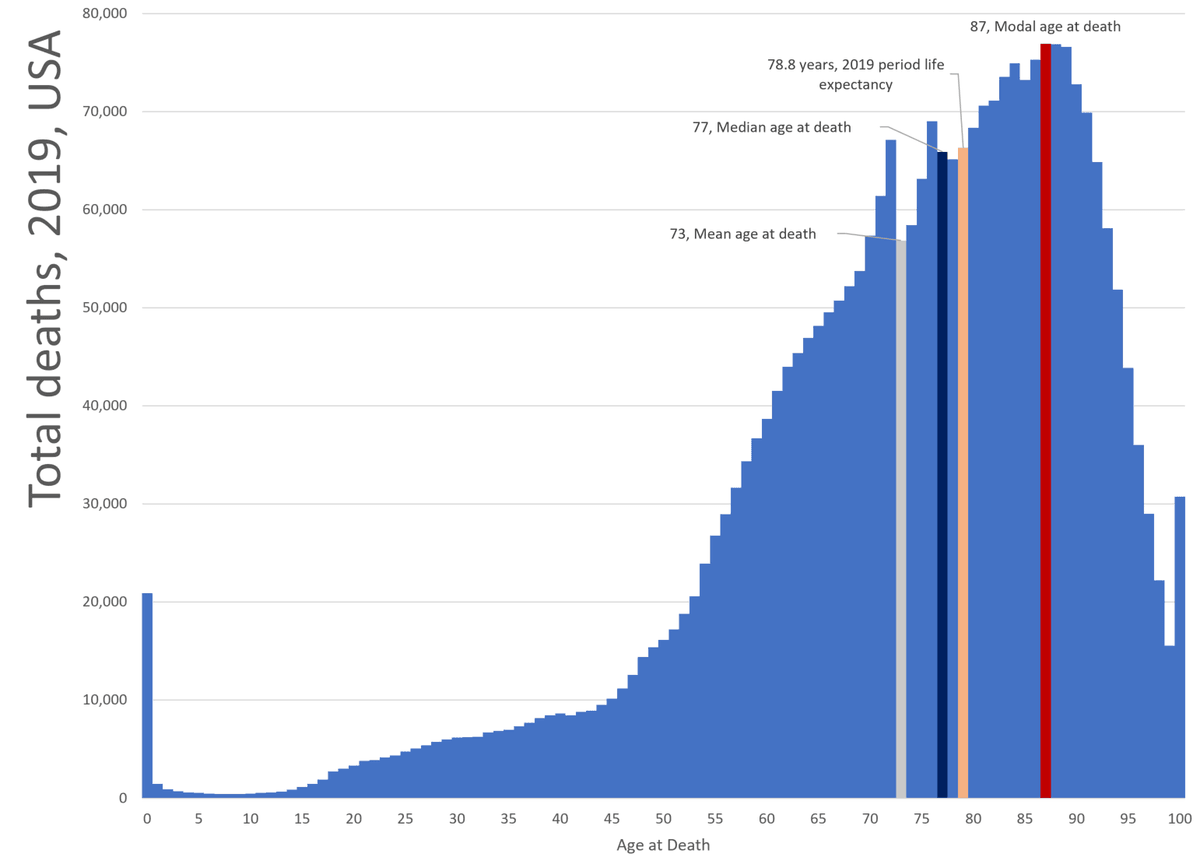
The chart shows the ages at which Americans died in 2019. The most likely age is 87. This compares to the "normal life exceptancy" or period life expectancy of 79. Different measures for different purposes.
The latest forecast from the University of Washington forecasts a Chinese Working Population at the same level as 1955 by 2100
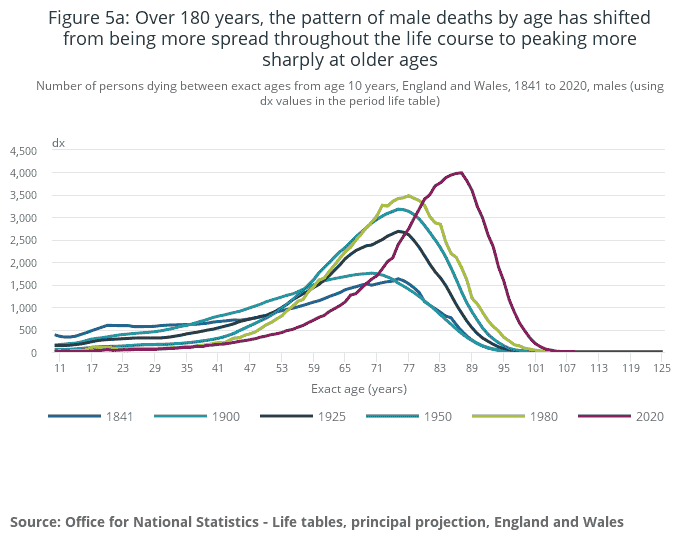
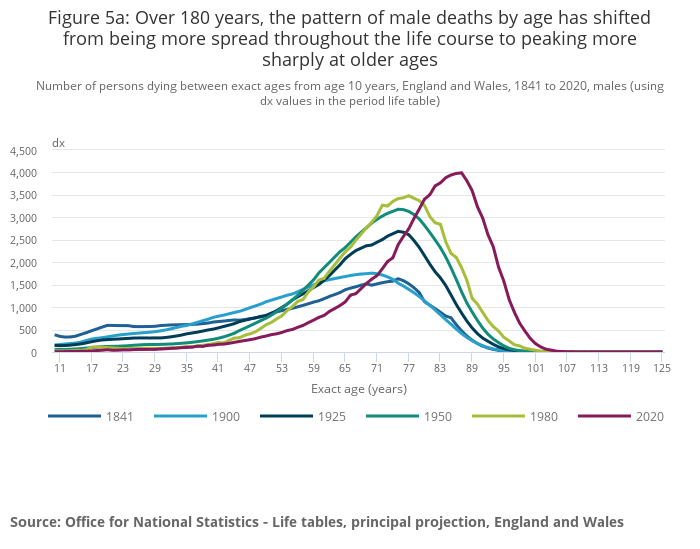
In the UK the "modal" age at death was remakably constant for hundreds of years. Only in the last 40 years has it grown by more than 10 years. It took nearly 150 years to grow 6 years.